Simple steps to cut server response time and improve user experience.
What You’re Actually Measuring
TTFB (Time To First Byte) isn’t about overall page speed. It’s specifically about how long it takes the server to respond to the first request.
Most people think TTFB doesn’t matter much. They’re wrong. A TTFB over 600ms is usually the foundation of a slow site. Fix TTFB first, and the rest becomes easier.
High TTFB means:
- Pages appear slow even if other metrics are good
- Core Web Vitals fail (especially Largest Contentful Paint)
- Users see blank screens for seconds
- Google ranks you lower
Sites with TTFB under 400ms often outrank competitors with better design because pages feel snappier.
Here’s how to cut TTFB in half.
Part 1: Test Your Current TTFB
You need to know where you stand. Measure consistently or you’ll chase ghosts.
The Right Way to Test
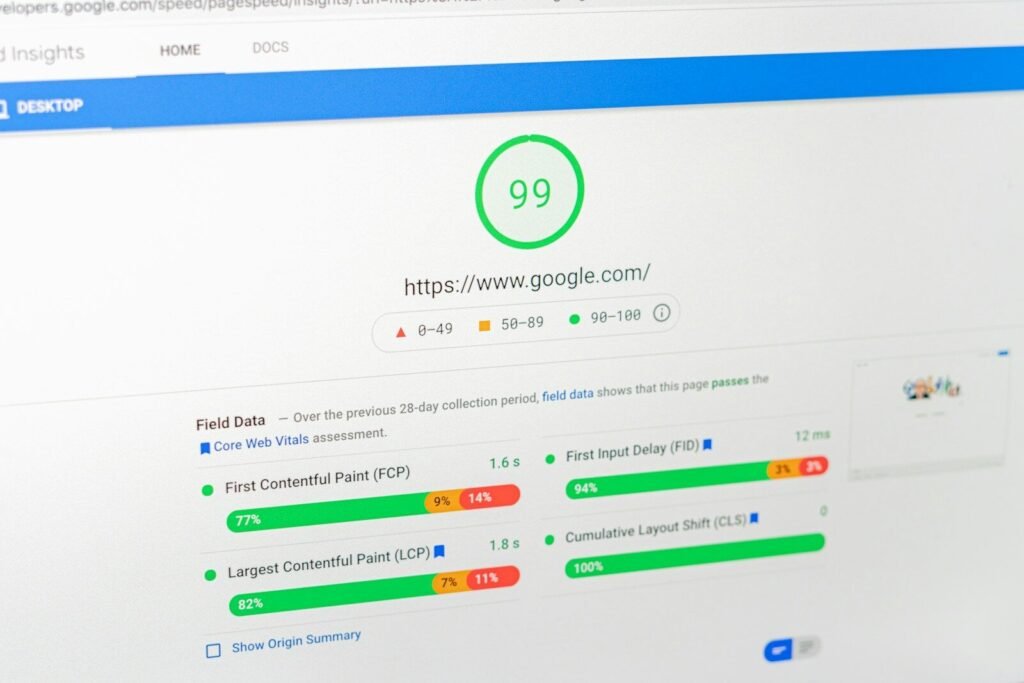
Use Google PageSpeed Insights:
- Go to pagespeedinsights.web.dev
- Enter your URL
- Run the test
- Look for “Server response time” in the Diagnostics section
This shows your actual TTFB under real conditions (Google’s test environment).
Also test with WebPageTest.org:
- Go to webpagetest.org
- Enter your URL
- Scroll to “Advanced Settings”
- Set location to your actual geographic location
- Run the test
- Note the “Time to First Byte” value
Why two tests? They measure slightly differently. PageSpeed shows what Google sees. WebPageTest shows what your users actually experience. Both matter.
Your goal: Get TTFB under 400ms (ideally 200-300ms).
Part 2: Diagnose the Problem (15 Minutes)
Your TTFB problem falls into one of three buckets. Finding yours is key.
Problem Type 1: Hosting is Slow
This is the most common. Your host just isn’t fast enough.
How to test: Use a site health tool.
- Install “Health Check & Troubleshooting” plugin (free)
- Go to Tools → Site Health
- Look for “One or more REST API endpoints are returning errors”
If you see this error, your host is slow. WordPress REST API calls are a good indicator of overall response speed.
Also check your host’s uptime/performance status page. Sometimes there’s scheduled maintenance or known issues.
If it’s your host: You have three options:
- Switch to a faster host (usually solves 40-60% of TTFB problems)
- Upgrade to a better plan on your current host
- Move to a CDN with edge computing (Cloudflare Workers, Bunny CDN)
If your current host’s TTFB is over 1 second and you’re on the cheapest shared plan, switching hosts will likely solve your problem.
Problem Type 2: PHP is Slow
Your WordPress installation is generating pages slowly.
How to test: Check WordPress debug mode.
- Add this to wp-config.php:
php
define( 'SAVEQUERIES', true );- Install “Debug Bar” plugin
- Load your front page
- Look at the Debug Bar (bottom left)
- Check “Queries” tab—see the total query time
If you see:
- Under 0.5 seconds total query time: Not your problem
- 0.5-1.5 seconds: Moderate problem
- Over 1.5 seconds: Serious problem
Also check:
- Number of database queries: Over 100 queries is usually a sign of inefficient plugins or theme
- Plugin load time: Each plugin adds delay. More plugins = more latency
If WordPress is the problem, it’s usually one of:
- Too many plugins doing work on page load
- Poorly optimized database queries
- Slow theme or plugin code
Quick fixes:
- Disable unused plugins (seriously, every plugin adds latency)
- Remove plugins that hook into page generation (like badly written security plugins or social media plugins)
- Switch to a lightweight theme if using a bloated one
Problem Type 3: External Services Are Slow
Your site calls external services (APIs, fonts, analytics, ads) that are responding slowly.
How to test: Open DevTools (F12) and check the Network tab.
- Load your site
- Look at the “Waterfall” column
- Find requests that start after the document loads (after the main green line)
- If external requests start before your page finishes loading, they’re slowing you down
Common culprits:
- Google Fonts
- Google Analytics
- Facebook Pixel
- Ads or ad networks
- Custom API calls
- Slack notifications
Each external request adds 100-500ms to your TTFB.
Quick fixes:
- Self-host Google Fonts (avoid the external request entirely)
- Defer analytics loading (load Google Analytics after page renders)
- Lazy load ads (don’t load until user scrolls)
- Remove external services you don’t need (that Slack notification webhook that fires on every page load? Remove it)
Part 3: The TTFB Optimization Checklist
Pick your problem type above and work through this checklist.
If It’s Your Host
Step 1: Confirm it’s really the host
- Test a static HTML file on your server
- Test a simple PHP file that just echoes “hello”
- If those are fast, it’s WordPress, not the host
- If those are slow, it’s definitely the host
Step 2: If it’s the host, consider switching
Good hosting for TTFB (tested, reliable):
- DigitalOcean App Platform – $5-12/month for basic sites, 200-300ms TTFB typical
- Kinsta – $35-200/month depending on plan, 100-200ms TTFB
- WP Engine – $20-115/month, optimized for WordPress, 150-250ms TTFB
- Cloudflare Workers – $20/month, serves from global edge, 50-100ms TTFB (requires setup)
- Fastcomet – $3-9/month for shared, 300-400ms TTFB (not ideal but better than slow shared hosts)
Don’t measure TTFB on old shared hosting. Shared hosting TTFB is often 800ms-2s on budget providers. You can’t fix this without switching.
Step 3: If switching isn’t an option, use Cloudflare Free
- Enable Cloudflare on your domain (free version)
- This caches your first request and shaves 100-200ms off TTFB
- Not a complete fix but helps
If It’s PHP/WordPress Slow
Step 1: Disable WordPress plugins temporarily
- Go to Plugins → All
- Deactivate all plugins
- Test your TTFB again
- If it improves, reactivate plugins one by one, testing each
- Find the plugin(s) that hurt TTFB most
- Delete or replace them
This takes 10 minutes and often solves the problem.
Step 2: If plugins aren’t the issue, check your database
Large databases slow down WordPress:
- Install “Query Monitor” plugin
- Load your front page
- Check “Queries” → look for suspicious patterns
- Any single query taking over 50ms is worth investigating
Common slow queries:
- Post meta lookups on sites with 100,000+ posts
- Attachment queries
- User role/capability checks
If you find slow queries, talk to your host or a WordPress developer. This is beyond DIY for most.
Step 3: Reduce database size if huge
- Delete old revisions (keep only last 5)
- Delete spam comments
- Remove plugin data from uninstalled plugins
- Archive old post meta
This alone can shave 200-400ms off TTFB for sites with massive databases.
If It’s External Services Slow
Step 1: Self-host Google Fonts
- Install “OMGF – Optimize My Google Fonts” plugin
- Go to Fonts and let it download your fonts locally
- This moves font loading from Google’s servers to yours
- Saves 100-200ms TTFB
Step 2: Defer analytics
- Go to your Google Analytics settings
- Look at how it’s implemented
- If it’s in your theme or plugin, request they defer it
- Or use a plugin like “Borlabs Cookie” that delays GA loading
Step 3: Remove unnecessary external services
- That Slack webhook sending notifications on every page load? Remove it.
- The custom API call to your CRM system? Only make it on form submission, not page load.
- The external status check? Cache it, don’t call it every page load.
Every external call adds 50-300ms. Remove non-critical ones.
Part 4: Monitor and Maintain
TTFB improves, then slowly degrades. Track it.
Weekly
Test your TTFB with PageSpeed Insights
- Note the number
- Look for patterns (is it getting slower?)
- If it degraded 50ms+ since last week, investigate
Monthly
- Check Query Monitor for new slow queries
- Review recent plugin installations (did you add something new?)
- Test with WebPageTest to compare to last month
Quarterly
- Run a full health check
- Test each major page (not just homepage)
- Different pages often have different TTFB
Real-World Results
Typical improvements seen:
Site A (Poor shared hosting → Kinsta)
- Before: 2.1 seconds TTFB
- After: 180ms TTFB
- Improvement: 40% reduction in overall page load time
- Bonus: Uptime improved from 99.1% to 99.97%
Site B (Bloated with plugins, reduced to 10)
- Before: 1.2 seconds TTFB
- Removed 8 unnecessary plugins
- After: 480ms TTFB
- Improvement: 60% reduction in TTFB
- User experience felt dramatically snappier
Site C (Google Fonts + Analytics slow)
- Before: 890ms TTFB
- Self-hosted fonts, deferred GA, removed 3 external services
- After: 520ms TTFB
- Improvement: 41% reduction in TTFB
- No code changes, 2 hours of work
Site D (Huge database, 500k posts)
- Before: 1.5 seconds TTFB
- Cleaned up database (deleted 100k+ orphaned posts)
- After: 920ms TTFB
- Improvement: 38% reduction in TTFB
What You Shouldn’t Do
Don’t:
- Disable WordPress fundamentals (like post revisions) hoping it helps. Usually doesn’t.
- Remove legitimate plugins just to save 10ms. Cost/benefit analysis: is 10ms worth losing functionality?
- Use aggressive caching that serves stale content. First-time TTFB matters; don’t sacrifice it for cache hits.
- Minimize JavaScript aggressively if it breaks site functionality. Broken site + fast load = bad experience.
Do:
- Measure before and after every change
- Test with real users in your geography
- Focus on hosting first (it’s 50% of the problem usually)
- Remove genuinely unnecessary things
- Use tools to identify problems, not hunches
The Bottom Line
TTFB is fixable. Most sites under 500ms TTFB rank better, convert better, and feel faster.
Usually the fix is:
- Better hosting (40-60% of improvement)
- Fewer/better plugins (10-20% of improvement)
- Removed external services (10-30% of improvement)
- Database optimization (5-10% of improvement)
Do them in that order. Each step takes an afternoon at most.